Last year over 700 boat owners who have non-trailered boats moored in marinas around Aotearoa…
Quantifying the movement dynamics of New Zealand’s recreational vessels to inform proactive management of non-indigenous species
The most recent publication from Kyle Hilliam’s PhD Project, as part of the MANAGE & RESPOND team, focuses on quantifying the movement dynamics of New Zealand’s recreational vessel to inform proactive management to prevent the spread of non-indigenous species (NIS). The identification of spreading hubs and locations at particular risk of NIS introductions enables managers to design risk-based and effective surveillance and monitoring programmes. The network-based approach to determine the biosecurity implications posed by recreational vessels is transferable to other parts of the world. It enables managers to understand the distribution of risk within an area of interest (e.g. a jurisdiction) and to develop optimised approaches for mitigating impact.
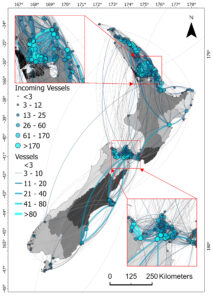
Recreational vessel network of New Zealand. Connections extend to the Kermadec Islands in the north, and the Auckland Islands in the south. Regions are coloured by human population (based on 2018 census), with darker indicating a greater population. Direction of travel is implied by following the connections clockwise. The northern inset map focuses on the Hauraki Gulf, and the southern inset map on the Marlborough Sounds in the west and Wellington in the east.
First, as there is no readily available data on the movement of most recreational vessels, an online based spatial survey was distributed with the help of Yachting New Zealand, the New Zealand Marina Operators Association and regional harbour masters to gather recreational vessel movement data. This survey received over 1,800 respondents and over 12,000 points visited. These vessel routes were used to build a network model representing nationwide recreational vessel movements. Two proxies were used to quantify the risk of introduction of marine NIS: (i) incoming hull length and (ii) cumulative residency periods at sites.
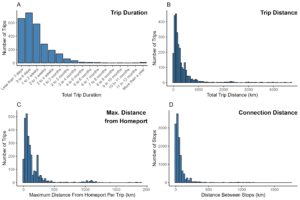
Trip descriptors for recreational vessels in New Zealand (of 2,813 total survey trips). The number of trips is the same between Figures A through C (2,813), whilst D is the number of stops on these trips. B uses a bin size of 50km, while C & D use a bin size of 25km. B is cut at 1000km, and C & D at 500km as this shows the overall trend.
There was significant variation in the distances traveled, the destinations they visited and the duration of their stays. New Zealand’s recreational boating network contained 317 destinations with over 4,000 unique connections, concentrated within two distinct areas of the country. Network-based metrics and risk proxies quantified the relative importance of domestic locations as incursion or spreading hubs for NIS. This approach highlighted several areas that pose high relative biosecurity risk within the national network, but are underrepresented within current surveillance programmes.
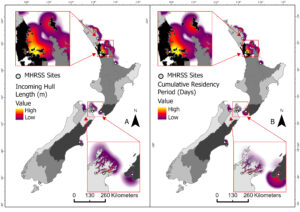
Risk intensity of destinations, weighted by incoming hull length (A) and cumulative residency periods (B). Marine High Risk Site Surveillance sites are shown. The northern inset map focuses on the Hauraki Gulf, and the southern inset map on the Marlborough Sounds in the west and Wellington in the east.
Link to the paper: https://besjournals.onlinelibrary.wiley.com/doi/10.1111/1365-2664.14660
And a link to an interactive map: https://posit.cloud/content/7889418
Related Posts

Comments (0)